Tags:论文信誉排行网
如今已没有几个行业可以完全不涉及统计学思维的,绝大多数学科都多少需要使用统计学….. 统计学已经从我们日常思维的一个方面发展为无处不在的系统性研究工具….统计学思维承认: 我们对世界的观察总存在某些不确定性,永不可能完全准确。
Rowntree D (1981). Statistics without tears. A primer for non-mathematicians. Penguin Books Ltd., London, England.
统计是指收集、处理和解释数据的方法。由于统计方法是科学探索的固有内容,因此我们的博客已经在研究设计、方法、结果、图表等数处提及统计。但考虑到统计在多数科学研究中的重要性,有必要专门讲解其使用和表达。
在 开始研究之前,在初步的研究设计中就应该考虑统计。首先,要考虑你需要收集哪些信息来检验你的假设或解答你的研究问题。研究有个正确的开始非常重要;虽然 数据检验错误相对容易弥补,要用另外的样本组重新收集数据或者从同一样本中追加获取变量可就费时费力得多。如果你想检验某种疗法对普通人群的效果,你的样 本要能够代表这个群体。如果比较的是分别有两种疾病或行为的两个群体,那这两个群体的其他变量如年龄、性别、种族需要尽可能一致。这些涉及的都是数据收 集;如果在这一步就犯了错,你就有可能遇到严重的问题,甚至可能会在数个月后在同行审稿阶段遭到严重质疑而推翻重来。
其次,你要考虑要采 用何种统计检验才能从数据中提炼出有意义的结论。这取决于数据类型。是用来表达某种标志物存在与否的分类数据吗?还是有具体数值的定量数据?如果是定量数 据,是连续数据(测量所得)还是离散数据(计数所得)?例如,年龄、体重、时间和温度都是连续数据因为他们的值是在连续,无限可分的尺度上测量出来的;相 反,人和细胞的数目都是离散数据,他们不是无限可分的,他们的值是通过计数得到的。你也需要知道你数据的分布:是正态(高斯)分布还是偏态分布?这也关系 到你该采取何种检验。你一定要知道你收集的是何种类型的数据,这样才能用适宜的统计检验来分析和恰当的方式来表示。下面这个网址提供了选择适宜检验方法的 指南,可能会有所帮助:http://www.graphpad.com/www/Book/Choose.htm
最后,需要知道如何解 读统计检验的结果。P值(或 t、 χ2等)代表什么意思?这是统计检验的关键:确定结果到底意味着什么,你能下什么结论?统计能告诉我们某一数据集的集中趋势(如平均值和中位数)和离散趋势(标准差、标准误和百分位间距),从而明确该数据集的分布情况。统计学可以比较(如用t检验、方差分析和χ2检验)两个或多个样本组之间是否有非偶然的系 统性差别。如果检验表明无效假设可能性很小,则差别具有显著性。一定要记住,用概率简化差别的“真实性”造成了两种风险,两种都取决于所选取显著性的阈 值。第一个是第1类错误,是指本没有显著性差异之处检出了显著性差异。另一个是第2类错误,是指本有显著性差异但由于差别不够大而不能捡出。降低第1类错 误的风险就会增加第2类错误的风险;不过这也比下不存在的结论要好。统计学也能给出关联的强度,从而允许从样本组中推断出适用于更广群体的结论。统计学赋 予了本身价值有限的结果更多意义,并允许我们用概率下结论,虽然总是存在错误的可能。
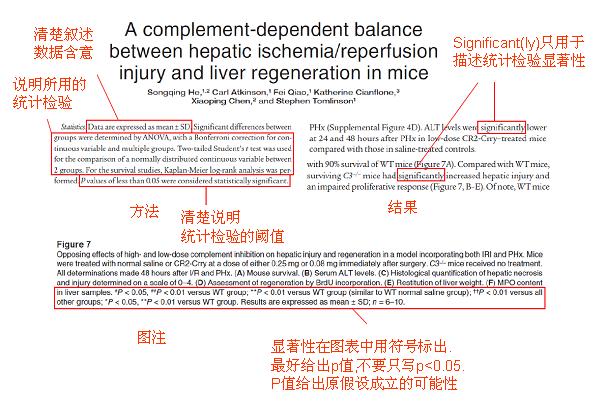
实例
 节选自《The Journal of Clinical Investigation》 (doi:10.1172/JCI38289; 经同意转载)。
清单
1. 在列举数据时,说明使用的是何种参数,如“均值±标准差”。
2. 说明数据分析所采用的统计检验方法。
3. 百分比给出分子分母,如“40% (100/250)”。
4. 正态分布数据用均值和标准差表示。
5. 非正态分布数据用中位数和 百分位数表示。
6. 给出具体的P 值, 如 写出 “P=0.0035”,而不要只写 “P<0.05”。
7. “significant’ 这个词仅用于描述统计学上的显著差异。
英文原文
Statistics: what can we say about our findings?
Today, few professional activities are untouched by statistical thinking, and most academic disciplines use it to a greater or lesser degree…Statistics has developed out of an aspect of our everyday thinking to be a ubiquitous tool of systematic research… Statistical thinking is a way of recognizing that our observations of the world can never be totally accurate; they are always somewhat uncertain.
Rowntree D (1981). Statistics without tears. A primer for non-mathematicians. Penguin Books Ltd., London, England.
The term ‘statistics’ refers to the methods used to collect, process and interpret data. Because these methods are so inherent in the process of scientific inquiry, there have been multiple references to statistics throughout our blog, namely, in the posts on study design, methods, results and display items. However, given the importance of statistics in most scientific studies, it is worthwhile having a separate post on how they should be used and presented.
Statistics should first be considered long before the commencement of any research, during the initial study design. First, consider what information you need to collect in order to test your hypothesis or address your research question. It is important to get this right from the outset because, while data can be reanalyzed relatively easily if the wrong tests were used, it is far more difficult and time-consuming to repeat data collection with a different sample group or obtain additional variables from the same sample. If you wish to test the efficacy of a treatment for use in the general population, then your sample needs to be representative of the general population. If you wish to test its efficacy in a given ethnicity or age group, then your sample needs to be representative of that group. If comparing two groups of subjects separated on the basis of a particular disease or behavior, then other variables, such as age, sex and ethnicity, need to be matched as closely as possible between the two groups. This aspect of statistics relates to the collection of data; get it wrong and you could face major problems, potentially the need to start the research all over again, at the peer review stage many months later.
Second, you need to consider what statistical tests should be applied so that you can make meaningful statements about your data. This depends on the type of data you have collected: do you have categorical data, perhaps describing the presence or absence of a particular marker, or quantitative data with numerical values? If your data is quantitative, is it continuous (that is, can it be measured) or discrete (counts)? For example, age, weight, time and temperature are all examples of continuous data because they are measured on continuous scales with units that are infinitely sub-divisible. By contrast, the number of people in a given group and the number of cells with apoptotic features are examples of discrete data that need to be counted and are not sub-divisible. You also need to know how your data is distributed: is it normally distributed (Gaussian) or skewed? This also affects the type of test that should be used. It is important that you know what type of data you are collecting so that you apply the appropriate statistical tests to analyze the data and so you present them in an appropriate manner. The following useful website provides a guide to choosing the appropriate statistical test: http://www.graphpad.com/www/Book/Choose.htm
Finally, you need to know how to interpret the results of the statistical tests you have selected. What exactly does the p (or t or χ2 or other) value mean? That, after all is the point of statistical analysis: to determine what you can say about your findings; what they really mean. Statistics enable us to determine the central tendency (for example, mean and median) and dispersion (for example, standard deviation, standard error, and interpercentile range) of a dataset, giving us an idea of its distribution.
Also using statistics, values from two or more different sample groups can be compared (for example, by t-test, analysis of variance, or χ2 test) to determine if a difference between or among groups could have arisen by chance. If this hypothesis, known as the null hypothesis, can be shown to be highly unlikely (usually less than 5% chance), then the difference is said to be significant. It is important to keep in mind that there are two risks associated with reducing a decision about the ‘reality’ of a difference to probabilities, and both depend on the threshold set to determine significance: the first, known as type I error, is the possibility that a difference is accepted as significant when it is not; the opposite risk, known as type II error, refers to the possibility that a significant difference is considered not to be significant because we demand a larger difference between groups to be certain. Reducing the risk of type I errors increases the risk of type II errors, but this is infinitely more preferable than reaching a conclusion that isn’t justified. Statistics also provides a measure of the strengths of correlations and enables inferences about a much larger population to be drawn on the basis of findings in a sample group. In this way, statistics puts meaning into findings that would otherwise be of limited value, and allows us to draw conclusions based on probabilities, even when the possibility of error remains.
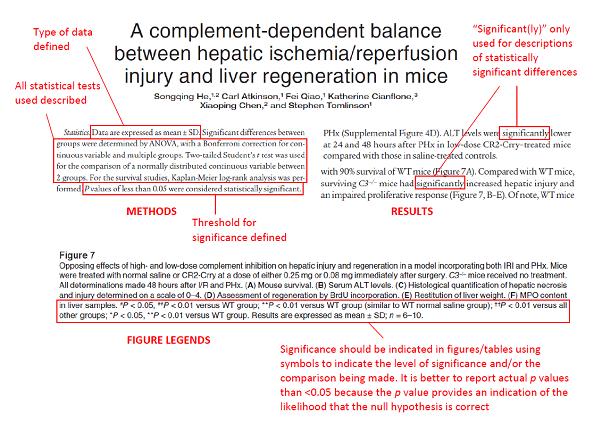
Example
 Extracts from The Journal of Clinical Investigation (doi:10.1172/JCI38289; reproduced with permission).
Checklist
1. Indicate what parameters are described when listing data; for example, “means±S.D.”
2. Indicate the statistical tests used to analyze data
3. Give the numerator and denominator with percentages; for example “40% (100/250)”
4. Use means and standard deviations to report normally distributed data
5. Use medians and interpercentile ranges to report data with a skewed distribution
6. Report p values; for example, use “p=0.0035” rather than “p<0.05”
7. Only use the word “significant’ when describing statistically significant differences.
Dr Daniel McGowan
分子神经学博士
|


